Introduction |
|
|
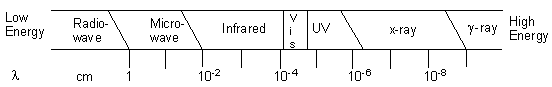
Spectroscopy is the study of the interaction of electromagnetic radiation and matter. What is electromagnetic radiation? It is any form of radiant energy that is propagated as waves, and includes what we commonly call "visible light". Electromagnetic radiation is characterized by the wave properties of frequency (ν), wavelength ( λ), and velocity (c). All electromagnetic radiation travels in a vacuum at a constant velocity: c = 3.00 x 10⁸ m/s, the speed of light. For light waves, the frequency and wavelength are inversely related, and their product is equal to velocity: ν λ= c Frequency is generally measured in Hertz-cycles per second (written 1/sec or sec-1). Wavelength can be measured in any unit for length, but nanometers (1 nm=1x10⁻⁹m) and meters are common. The energy (E) of electromagnetic radiation is directly proportional to its frequency: E = h ν Where h is Planck's Constant, equal to 6.626 x 10⁻³⁴ J-sec/photon. Thus, given any one of the three parameters, frequency, wavelength, or energy, the other two can be calculated. You might have noticed that Equation 1 talked about electromagnetic radiation as a wave, and that Equation 2 referred to individual particles-photons. Scientists have determined that it is best to think of electromagnetic radiation as being both wave-like and particle-like (they call this wave/particle duality). This is why you will sometimes hear Equation 1 applied to a photon and Equation two applied to a wave. Both are correct! The entire range of wavelengths of electromagnetic radiation is known as the electromagnetic spectrum, shown in Figure 1, below. Figure 1: The Electromagnetic Spectrum
As we can see from Figure 1, the electromagnetic spectrum is made up of many different kinds of radiation, from low frequency, low energy radiowaves with long wavelengths to high frequency, high energy gamma rays with short wavelengths. This experiment targets the visible region of this spectrum specifically, because we can see electromagnetic radiation with wavelengths in this region with our own eyes! Spectra are observed when matter emits or absorbs light. When an object acts as a source of radiation, it is said to emit radiation. When radiation from another source interacts with matter, the matter is said to absorb radiation. Examples of light-emitting objects include the Sun,
a red-hot iron bar, and the hot tungsten filament of an electric
light bulb. Emission of most radiation by matter occurs when its
atoms or molecules are excited by the absorption of energy from
another source. The source of all three examples of emission given
above is the extremely high temperature of the light-emitting object.
An emission spectrometer is used to analyze light
emitted from an excited source. As stated above, when radiation
from an external source interacts with matter, absorption occurs.
Certain characteristic frequencies of radiation are absorbed by
each kind of matter and these frequencies are thus missing from
the spectrum of radiation reflected from that object. A red apple
is absorbing white light and reflecting wavelengths of visible light
that are in the red region. An absorption spectrometer
is used to analyze light reflected by or transmitted through matter. Why use spectrometers? What do they tell us about the chemicals or systems under study? Spectroscopy is a fascinating way to probe the structure and composition of different molecules. Using spectroscopy, chemists can identify different species present in a sample or "map out" the structure of a molecule. One of the earliest clues that changed much of how we think about elemental substances was borne of spectroscopy. In 1885, Angstrom excited atomic hydrogen and recorded a series of visible lines that were emitted. The spectrum found is much different than the "rainbow" spectrum one sees when looking at white light through some sort of scope. Instead, the spectrum of atomic hydrogen contains a few narrow bands or lines of specific colors. Hydrogen is not the only element whose atoms possess an emission spectrum - the atoms of all elements do! Each has its own unique emission spectrum that consists only of a few narrow lines. This is very useful to the chemist; it is an elementary way of identifying elements! It is among the very best ways to identify the elements in samples are varied as seawater and distant stars. And it is exactly what you will employ today to determine the wavelengths of the hydrogen emission spectrum called the Balmer series. You will also use emission spectroscopy to identify an unknown cation in a salt. It might seem that spectroscopy is only a qualitative way of identifying different materials, but it is quite handy for quantitative measurements, too. Modern atomic orbital theory began with the excitation of an element's atoms by Angstrom, and has matured today to include the following important points about the hydrogen atom:
E = RH( 1/n2initial - 1/n2final) Where RH=2.18 x 10⁻¹⁸L J/photon, and ninitial
and nfinal are the principle If photon emission occurs, ninitial > nfinal,
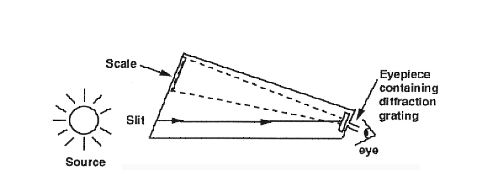
and E will be negative. If a Let's look at an example for clarification. An electron could be in hydrogen's lowest state (n=1, the ground state). Then, it absorbs a very specific amount of energy and is elevated to a higher energy orbital (say, n=3). The Rydberg equation would describe ΔE as positive, because ninitial=1 and nfinal=3. Then, the atom emits this energy, as the electron "falls" from n=3 to n=1. The Rydberg equation gives a negative ΔE for this transition, as now ninitial=3 and nfinal=1. This model explains why the frequencies of light absorbed are exactly equal to the frequencies of light emitted by a hydrogen sample. Electrons simply move from one energy level to another, either "up" or "down". Note that this also explains why emission only occurs after absorption of energy from another source; electrons must be excited above n=1 for emission to occur. Use of the Rydberg equation is permissible for all atoms or ions with one electron. The general equation includes a term, Z, for atomic number. For hydrogen, Z=1. For all other atoms or ions, Z is a positive, whole number. The general Rydberg equation is: ΔE = RHZ2( 1/n2initial - 1/n2final) Today, you will use the Rydberg equation when determining the spectral lines of the hydrogen emission spectrum. You will also look at the spectral lines and emission spectra of other elements as well. Since this experiment focuses on the visible region of the electromagnetic spectrum, some of the observing you do will be with your eyes. However, if we wish to study the frequencies of light emitted by or absorbed from a source, some way must be found to disperse these frequencies into a spectrum. For example, when white light is passed through a prism, a spectrum of colors results. This phenomenon occurs because the different wavelengths are refracted in the prism to different degrees. Accordingly, the resultant beam of light is split according to wavelength, or color. Rainbows are produced in a similar way, with raindrops acting as tiny prisms! An instrument that disperses radiation is variously called a spectroscope, spectrograph, or a spectrometer. A simplified diagram of the spectroscope you will use today and how it works is shown below in Figure 2. The slit regulates the amount of light which enters the spectroscope and thus the width of the resulting spectral lines. Light entering the slit passes through the spectroscope to the diffraction grating located in the eyepiece. Light passing through this grating is separated into its components. The scale, which is visible through the eyepiece, is illuminated by the light entering the spectroscope from a second direction. Thus, you will see the spectrum superimposed upon the scale, which is marked off in units of angstroms. Figure 2: Spectroscope Diagram
|
|