Calibrating the Spectroscope |
|||||||||||||||||
|
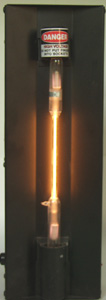
The calibration of your spectroscope is necessary to correct for systematic error. This is done by comparing your experimentally- determined wavelengths to wavelengths obtained from the literature. A convenient source of emission lines is the helium discharge tube. |
 |
||||||||||||||||
|
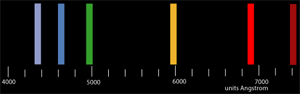
Proceed to the station with the helium tube in the power supply. Look through the eyepiece of your spectroscope and find the six helium lines. Note the position of these lines with regard to the scale and record their colors and their wavelengths in Angstroms in your laboratory notebook. |
 |
||||||||||||||||
|
Readings are dependent on the position of your eye. Therefore, one person should take the readings and should be consistent with the position of their eye relative to the eyepiece. |
|||||||||||||||||
|
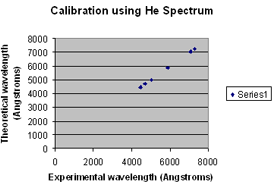
Prepare a calibration plot by graphing the scale reading obtained experimentally on the x axis versus the literature wavelength value on the y axis. You should use a full sheet of paper for the plot. This plot will be used to calculate the corrected wavelengths for the hydrogen spectrum and will be different for each spectroscope. Therefore, take data carefully and use your own, not another group's! |
|
||||||||||||||||
|
Here is an example of what a calibration graph looks like. |
|
||||||||||||||||